Diagnosis & Logging
drag&bot as KEBA Software-Unit
For diagnosis purposes it is possible to create a statereport from inside the Device Administration page of a KEBA PLC Device e.g. the CP 520/C. This site can be reached by opening the browser and entering the IP address of the KEBA PLC into the url field of the browser.
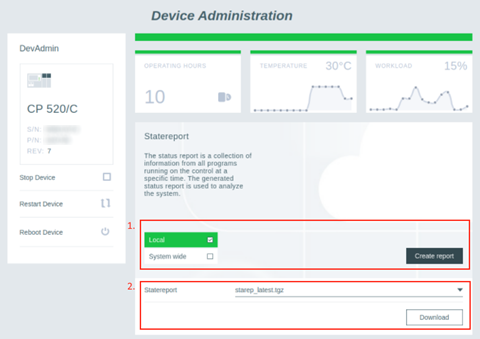
Now a statereport can be requested of the full Kemro X system together with the drag&bot module. There are two options available (see red box 1 in the picture above):
- Local: Choose local, when you want to create a statereport of the device where the device administrator UI is running e.g. C5 or DU3 controller
- System wide: A system wide state report with all additional devices e.g. KeTop, DM570.
Whenever the statereport is ready it can be downloaded from the device by clicking the Download button (see red box 2 in the picture above). The name of the download file will be statrep_latest.tgz. The file will be compressed as a .tar.gz Archive and will be structured as described in the following:
Filestructure Overview
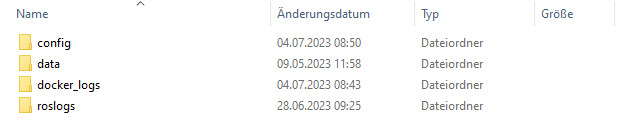
config/: Contains configuration data of drag&bot e.g. the Component-Manager startup list, naming of IOs, robot base transformation, a list of robot TCPs and more.data/: Contains a folder structure of drag&bot application data e.g. Datastore, grids, images, imports, meshes, programs, quick_access_poses, quick_programs, scenarios.roslogs/: Logfiles of the drag&bot Runtime in a ROS format.docker_logs/dnb_mongo/: MongoDB database log data docker logs.docker_logs/dnb_studio_fe/: The drag&bot frontend log data docker logs.docker_logs/dnb_studio_be/: The drag&bot backend log data docker logs.
config/ folder
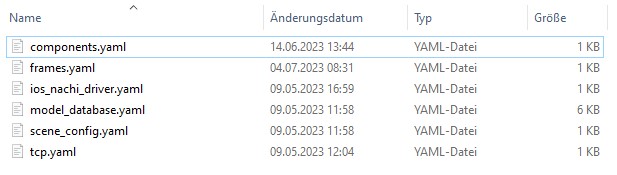
components.yaml: Contains a list of currently installed components. This component list do also contain the according configuration values like IP, port etc.frames.yaml: Contains the robot base transformation in respect to the world frame. Can also contain other transformation values.ios_<robot>_driver.yaml: A list of labeled I/O of the robot driver.model_database.yaml: A list of models used for the scene in the Scenario Designer.scene_config.yaml: Will have the path to the scene, when a predefined scene for the Scenario Designer was selected.tcp.yaml: A list of created tool center points (TCPs) for the current robot system.
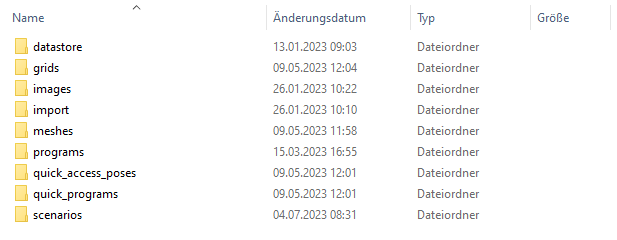
data/ folder
All application data of the current robot system.
roslogs/ folder
All application data of the current robot system.
Logging in UI
Whenever an error is thrown by drag&bot OS, this error will be written as a log inside the logging system of drag&bot. As an example we will start by throwing a simple TIMEOUT exception from within a running drag&bot application as seen in the following picture.
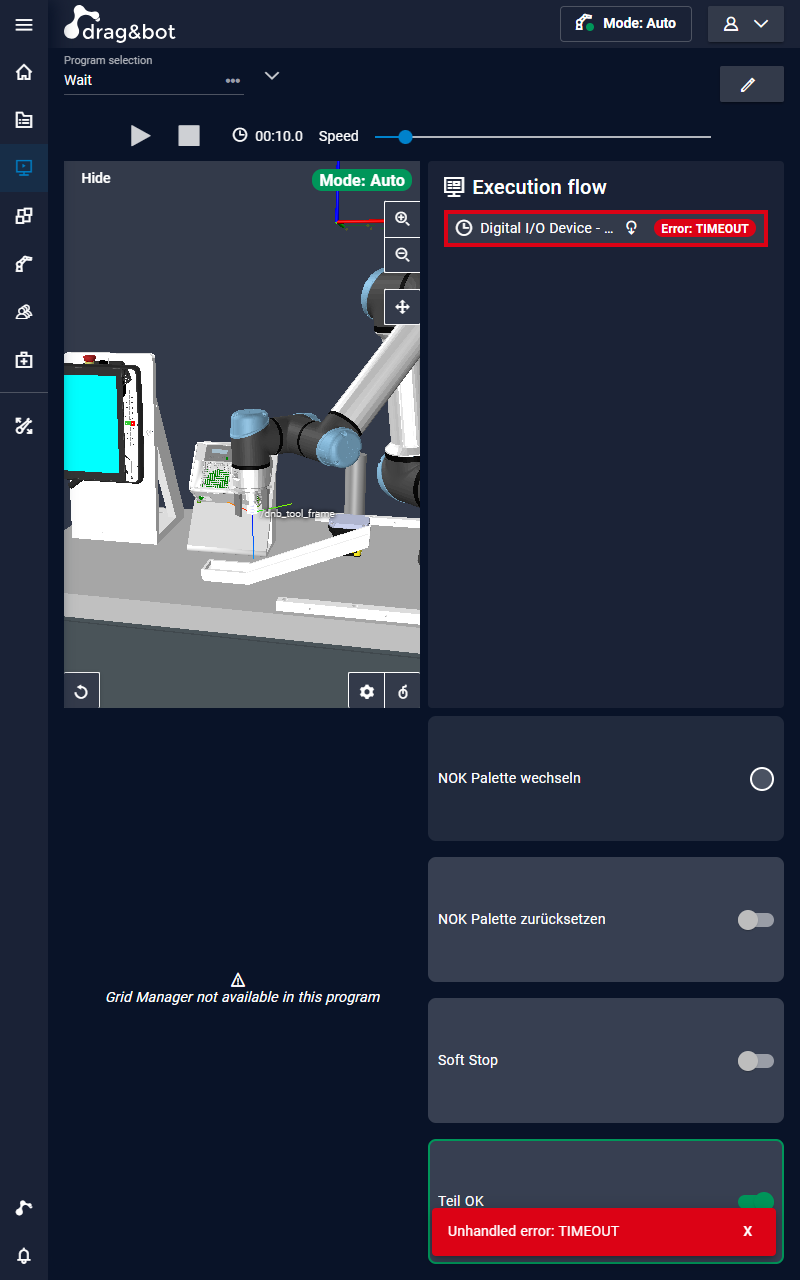
The above error was thrown by the Digital I/O Device - Wait for function block. In this case the timeout was reached and the error is unhandled which is shown to the user by a Toast message with the red error background in the drag&bot UI. This toast will disappear after a short time from the main view of the UI. To see all the past Toasts which were shown, open the Notification Area of drag&bot. To open it you need to click on the lower left bell icon. Then you will see the Toast history in the first view as shown in the following picture.
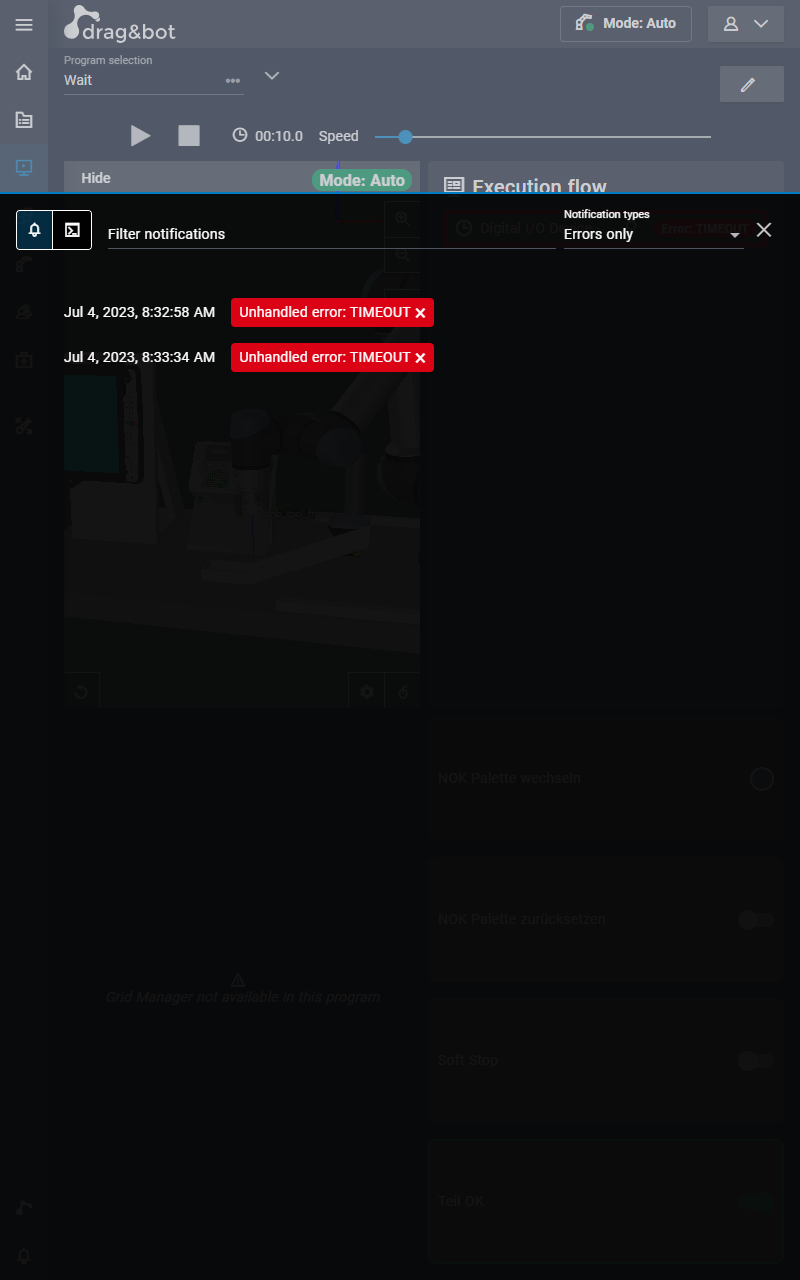
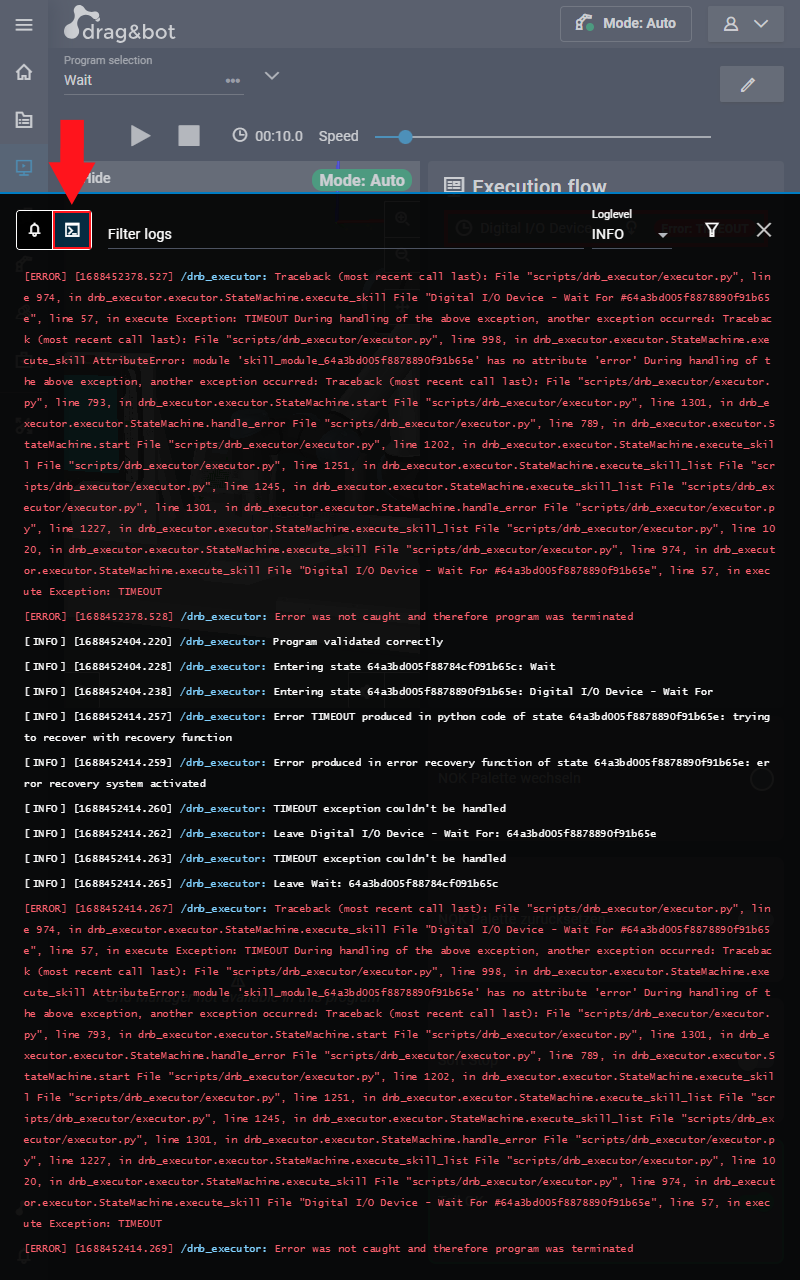
By clicking on the Console icon on the top you can change the view to the console output. This is a live output produced by the underlying ROS system which is running in the dnb_runtime container.
Logging in roslogs/
The above console output can also be found inside the statereport within the roslogs/ folder. To find the log inside the logging files follow these steps:
- Open the
roslogs/folder in the statereport tar. - Open the
log/folder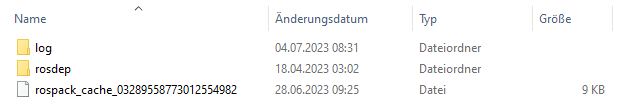
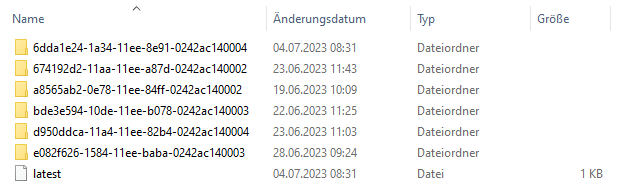
- Find the latest timestamp and open the folder
- You will see a list of all node logfiles of the running robot system. Open the file
dnb_executor-<number>.logas a textfile.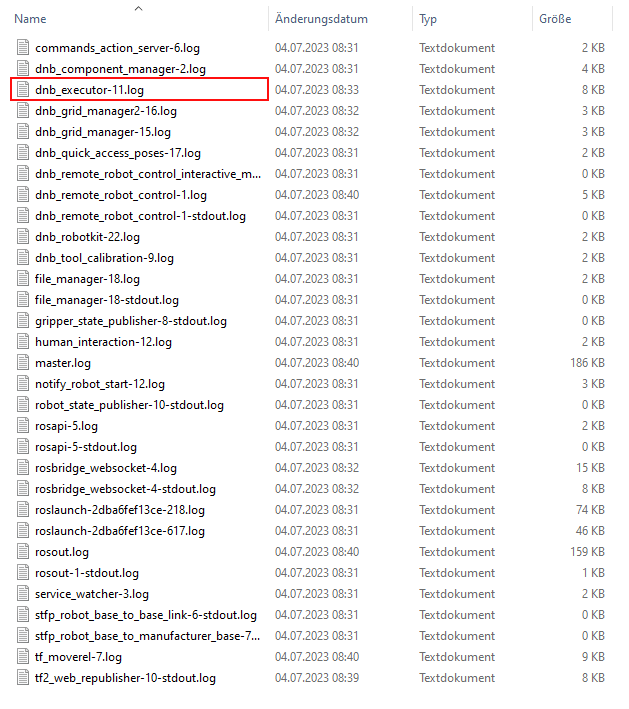
- Look for the TIMEOUT error or for other reasons why the executor state-machine was stopped
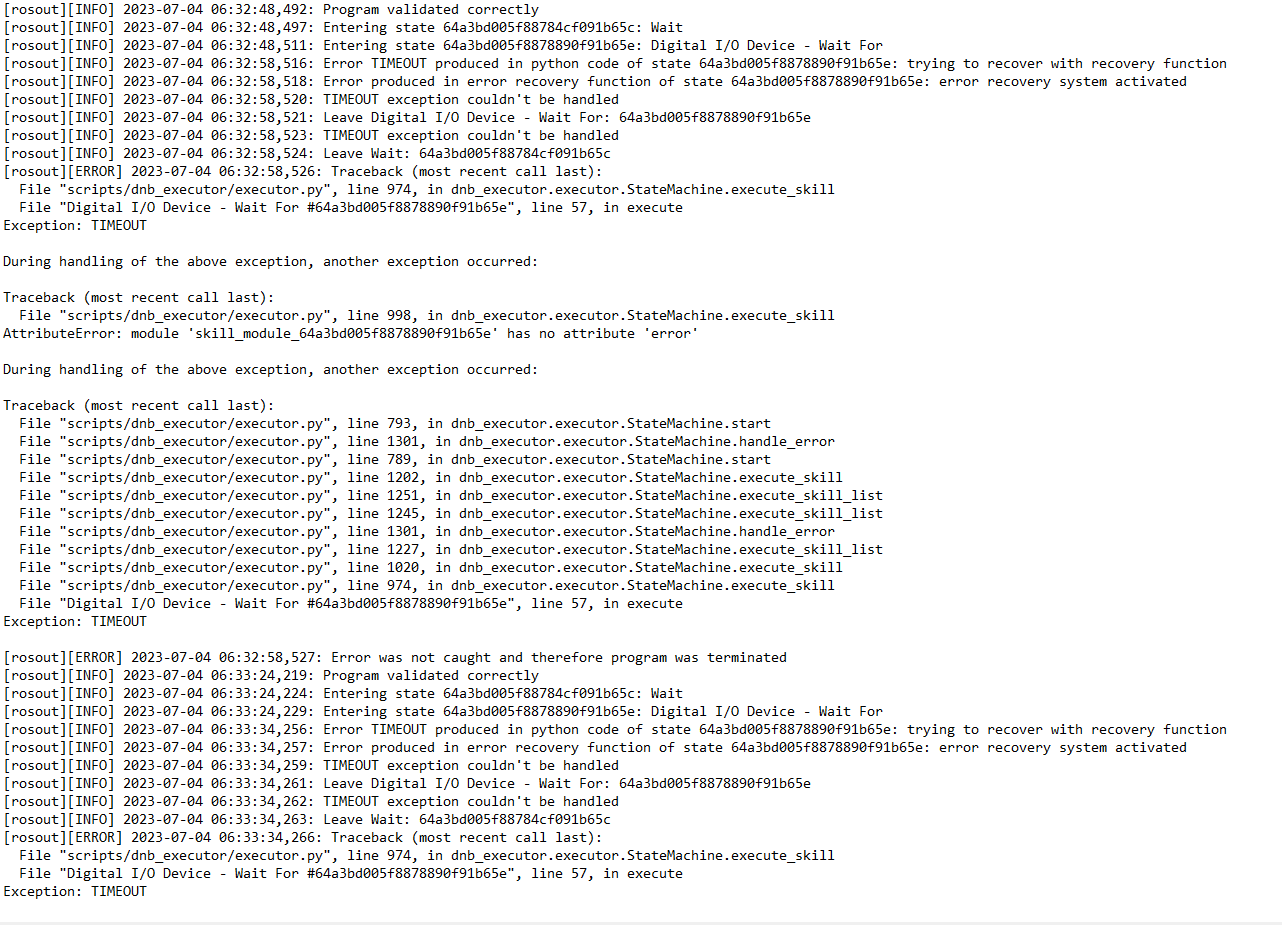
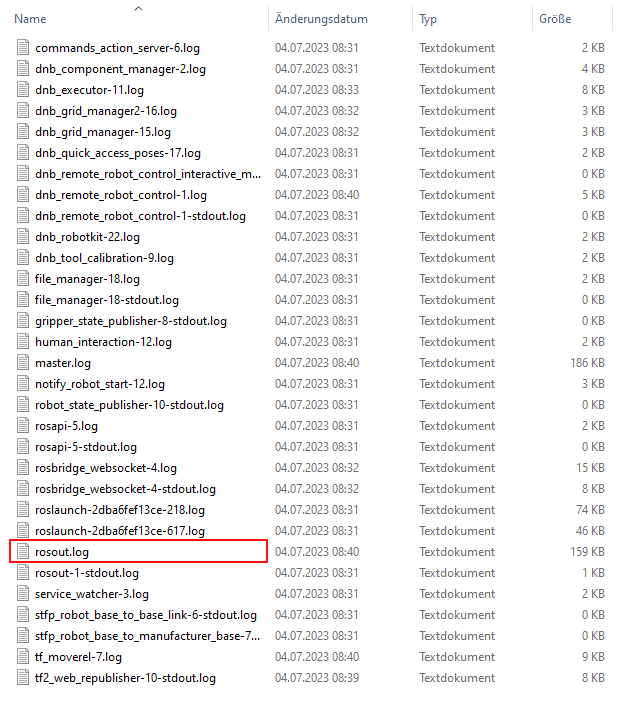
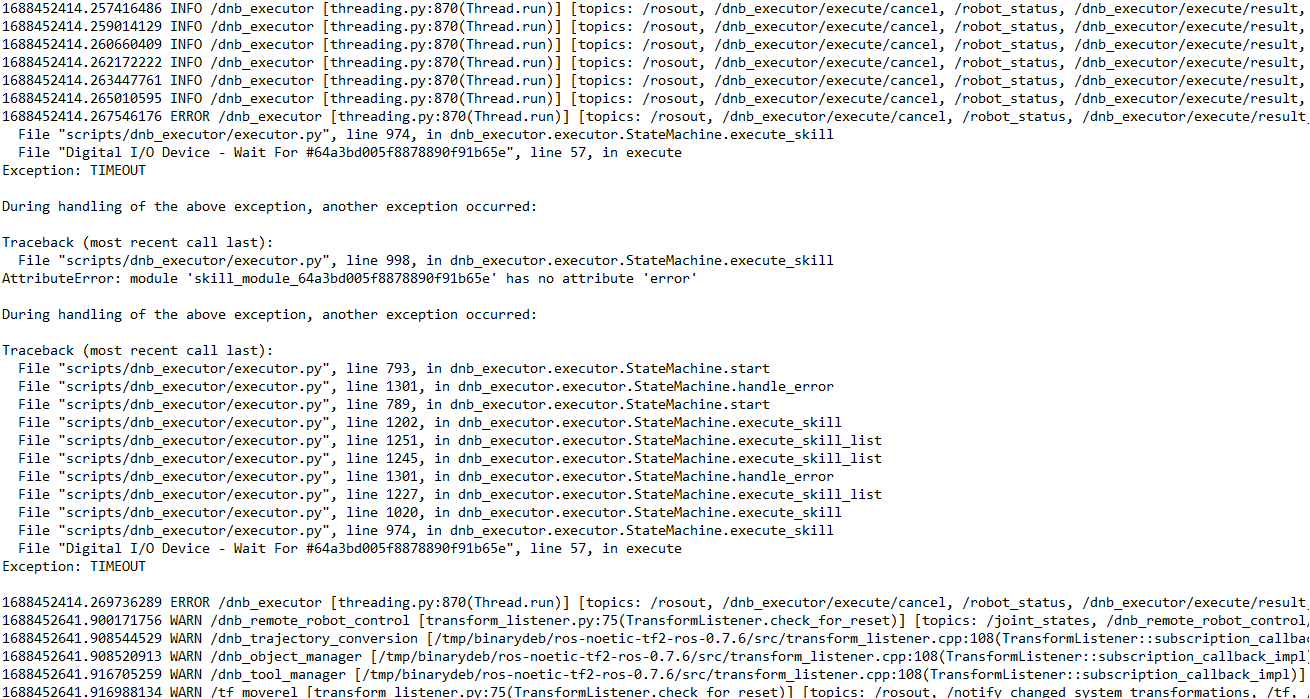
Alternative rosout.log
There is also the option to see all node outputs in one file which is the rosout.log. This file contains all the logs of all nodes which provides less overview. The timestamps provided here are UNIX timestamps. To convert them into readable timestamps you can use a coding interface like python or you can convert them online
by using the website: https://www.unixtimestamp.com/
The output will look like this:
Logging in docker_logs/
While roslogs/ will show application errors of drag&bot, there can be more reasons why a system is not healthy or did stop working. The reason maybe some system setting. A possible issue can be found by having a look inside the docker logs files provided inside the docker_logs/ folder.